


There are two different approaches to performance management in the Banking & Insurance sectors. The first is a classic and key approach, consisting in monitoring an organisation’s financial performance using data from cost accounting and transactional systems. The second, complementary to the first, is a “customer centric” approach, based on customer satisfaction management. With this...

There are two different approaches to performance management in the Banking & Insurance sectors. The first is a classic and key approach, consisting in monitoring an organisation’s financial performance using data from cost accounting and transactional systems.
The second, complementary to the first, is a “customer centric” approach, based on customer satisfaction management. With this second dashboard at hand, you will be able to identify areas for improvement in your customer experience, and to improve your customer satisfaction in the long-run.
Read on to discover our advice on how to build a customer satisfaction dashboard.
Managing customer satisfaction – choosing the indicators & areas of analysis
Measuring customer satisfaction is a widespread practice for a lot of organisations, across all industries. This is in part due to the emergence of technological solutions that facilitate the large-scale measurement of customer satisfaction. But it is also the result of a twofold observation:
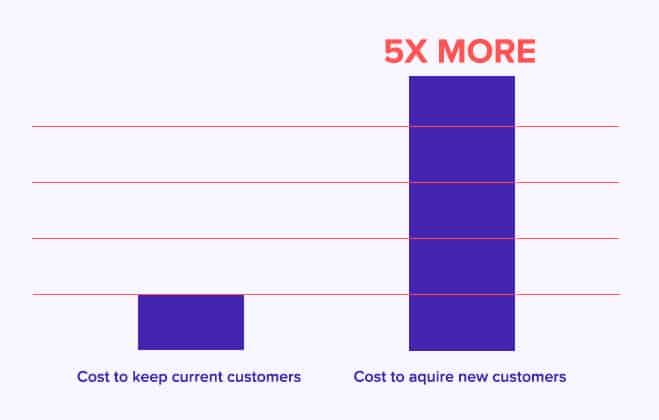
- Building customer loyalty is cheaper than acquiring new customers.
- The best way to build loyalty and retain customers is to generate customer satisfaction.
The above is particularly true of highly competitive sectors, such as Banking and Insurance.
Customers can change bank or insurance company at any time, so it is important to strive to ensure satisfaction and swiftly resolve any cases of customer dissatisfaction.
As you know, customer satisfaction is structurally mediocre in the Banking and Insurance sectors. Which is why, according to a Bain & Company study published by the La Tribune newspaper in 2018, one in four French people say that they could change banks within that year. Banks and insurance companies face greater customer retention challenges than any other industry. Building a customer dashboard is therefore essential.
The 3 key customer satisfaction indicators
Customer satisfaction is measured with customer satisfaction indicators. These indicators should be considered as key performance indicators, complementary to financial ones. If you regularly read this blog, you are most likely familiar with the three main ones:
- The Net Promoter Score, or NPS.
- The Customer Effort Score, or CES.
- The Customer Satisfaction Score, or CSAT.
Being familiar with these indicators is one thing. Successfully integrating them into a decision-making dashboard is another. Below we will take a look at a few examples of analysis areas to use in your dashboard, to efficiently manage your customer experience. They are primarily based on the Net Promoter Score, but most areas of analysis can be used with other indicators too.
To find out more about these key indicators, take a look at our article: Customer Satisfaction: Do you know the 4 key measures?
Monitoring the overall Net Promoter Score
A customer satisfaction indicator allows to:
- Know each of your individual customers’ level of satisfaction. This is known as the “micro” level.
- Know and manage your overall customer satisfaction, by aggregating all the satisfaction scores you have collected. This is known as the “macro” level.
Decision-making dashboards allow to monitor satisfaction indicators on an overall “macro” level. Take for example the Net Promoter Score. With this indicator you can:
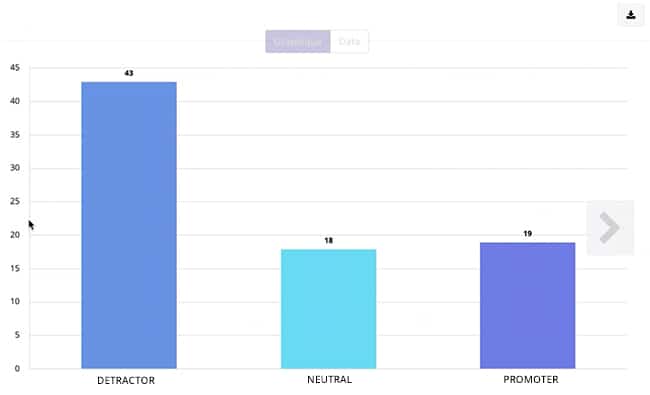
- Classify your customers into 3 categories: promoters, detractors, and “neutral” customers.
- Calculate an overall score by subtracting the percentage of detractors from the percentage of promoters. For example, if you have 30% of promoters and 13% of detractors, your NPS is 17 (30-13).
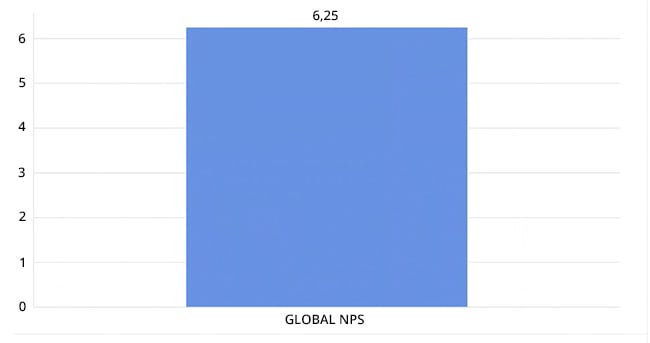
To start out, we recommend adding the overall NPS score and the promoter / neutral / detractor customer breakdown to your dashboard.
Monitoring the evolution of your satisfaction indicators over time
We suggest measuring the evolution of your indicator over time, ideally on a monthly basis. It is important to know your NPS score at a specific moment in time but is just as important to see how this indicator evolves over the months.
Monitoring the evolution of customer satisfaction will allow you to measure to what extent your services and products are in line with your customers’ needs and expectations. Several types of charts can be used to visualise these evolutions, particularly line graphs, although there are other possibilities too.
A few examples of satisfaction indicator analysis
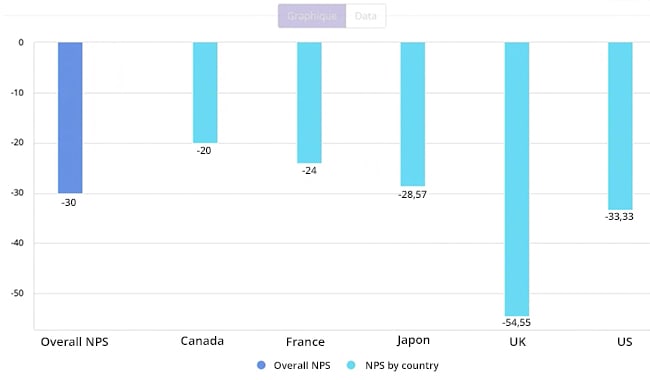
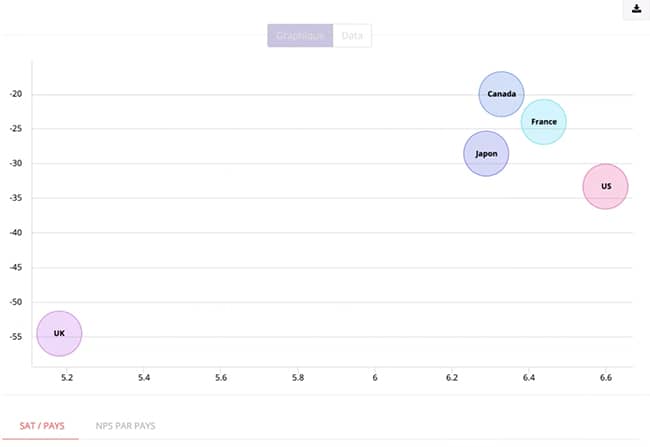
You can enhance your dashboard by integrating additional analysis areas to your indicators. For example, a lot of banks or insurance companies have branches in several countries. In which case, it could be interesting to compare the different countries. For example: to compare the overall NPS with the NPS per country.
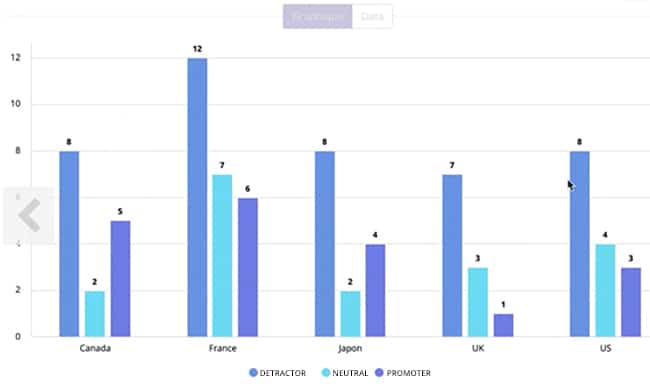
You can also compare your promoter / passive / detractor customer breakdown on a daily (or monthly) basis.
It could also be interesting to compare the promoter/passive/detractor breakdown at a specific moment in time per country. Several MyFeelBack clients in Banking & Insurance do this.
If you are using several indicators, it is always interesting to cross-reference them to obtain additional information. For example, if you use both CSAT and NPS, you can cross-reference them to identify (among other things) your most satisfied promoters – otherwise known as “super-promoters”, meaning very satisfied (CSAT) promoter customers (NPS).
As you can see, integrating satisfaction indicators into your dashboard is not just about displaying an overall score. There are a number of possibilities that, combined, will allow you to build a real customer satisfaction barometer.
Managing customer satisfaction beyond indicators
Customer satisfaction is not just about measuring the above key indicators. You can further enhance your customer dashboard by:
Knowing your business’ strengths and weaknesses
What do your customers appreciate the most? And, on the flipside, what causes the most dissatisfaction or frustration? It could be worth integrating this information into your dashboard.
Start by identifying the items you want to rate, those that are relevant to your business. This could be:
- Key touchpoints, meaning the “moments of truth” on your customer journey: the welcome, registration process, advice, customer service and care, etc.
- Or the Banking & Insurance products and services you offer customers.
Once these items have been identified, build a survey to collect your customers’ feedback. We will come back to the important issue of collecting satisfaction from your customers at the end.
Integrating verbatims into your management dashboard
Collecting verbatims from customers allows you to gather suggestions for improvement and to identify areas you may not have thought about before. They allow to enhance the Voice of the Customer. The indicators presented above are mainly expressed in numbers. Whereas verbatims are, as the name suggests, verbal. They can nonetheless be integrated into your dashboard.
Techniques for integrating verbatims into your dashboard
There are several ways to collect verbatims, particularly:
- Via Customer Services when there is an interaction.
- Via surveys, by including open-ended questions or an open field at the end of the survey asking the customer to make suggestions.
Here are a few techniques for integrating verbatims into your dashboard:
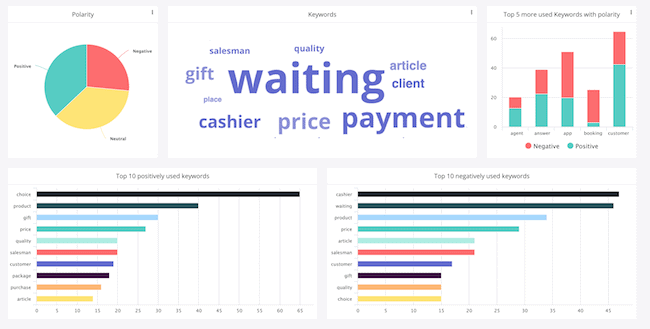
- A tag cloud, to view the most frequently used customer words in verbatims.
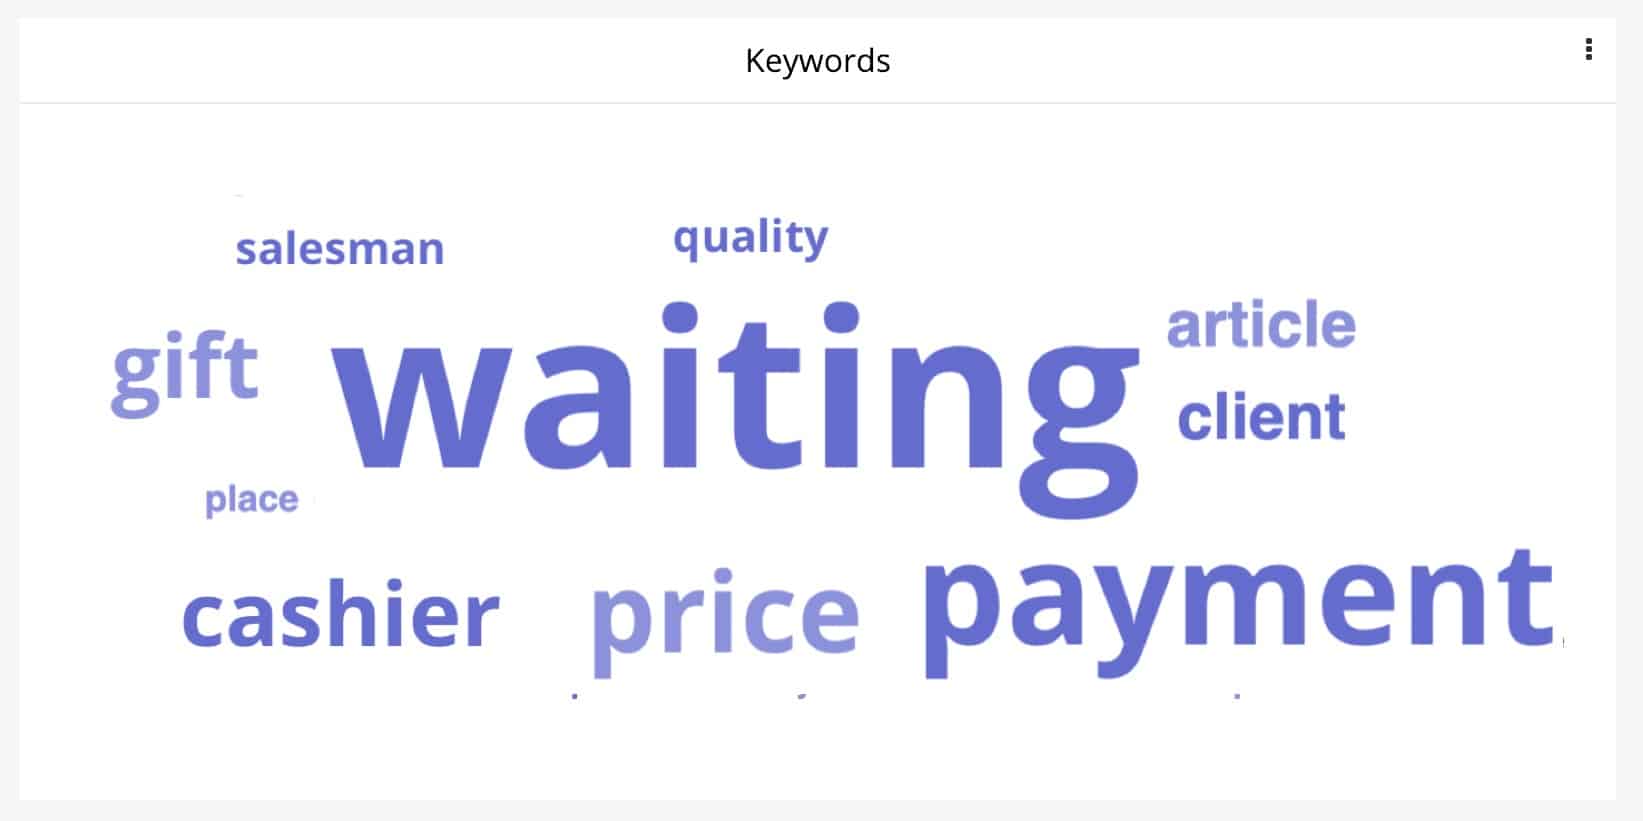
- Or instead of a tag cloud, a representation in the form of a chart list.
- A breakdown of positive / negative comments. If you are collecting verbatims through surveys, there are solutions (such as MyFeelBack) that incorporate semantic analysis technologies, to automatically identify whether a verbatim is positive, or not, based on the words or expressions used.
Enhancing your dashboard with Customer Knowledge
You can enhance your customer satisfaction dashboard with useful information about your customers. This will reveal what your customers think about your establishment, but also who they are.
Why use Customer Knowledge oriented indicators?
Customer Satisfaction and Customer Knowledge are intricately linked. The better you know your customers and who they are, the better you can serve them and meet their expectations. Customer Knowledge is a prerequisite for improving your customer experience. It therefore makes perfect sense to integrate a few Customer Knowledge oriented indicators into your dashboard.
Incorporating customer profiles
We recommend focusing on one kind of data to not overload your customer dashboard – socio-demographic data. For example, you could incorporate a customer breakdown by age, sex, or geographical area into the dashboard, but also information relating to your customers’ financial situation.
You could go even further and include other data, but in that case, we recommend building another dashboard.
Conclusion
In conclusion, we would like to stress one point in particular. A key point. In order to build a customer satisfaction dashboard, you must implement a data collecting strategy, in order to continually collect satisfaction scores, customer ratings of key items, verbatims, and customer knowledge information that is not readily available to you.
Surveys are the simplest, most efficient, and scalable tools to do so. They can be deployed on the channels of your choice (personal account, email, post-interaction, etc.), whenever you want. The answers are then automatically integrated into your dashboard. You will find lots of articles about surveys on this blog. Feel free to browse them.
Discover The Ultimate Guide To Creating A Customer Survey (With Questions!)
Building a dashboard will help you identify areas for improvement in your customer experience and to make more customer-centric decisions, following these three steps: measure – analyse – act.
Our Banking & Insurance clients who have implemented customer dashboards have noted a considerable improvement in their overall customer satisfaction scores. Over to you!