


The quality of your customer experience is what sets you apart from the competition. To manage your customer experience, identify your strengths and detect problems and areas for improvement, you need to build a solid experience measurement system. Which brings us to the heart of this article: which indicators should you use to measure your...

The quality of your customer experience is what sets you apart from the competition. To manage your customer experience, identify your strengths and detect problems and areas for improvement, you need to build a solid experience measurement system.
Which brings us to the heart of this article: which indicators should you use to measure your experience? Which KPIs enable you to monitor your customers’ satisfaction with the experience you offer? After much thought, we’ve selected 7 KPIs which we believe are key to measuring customer experience. Here they are.
1 – Customer Experience and Net Promoter Score (NPS)
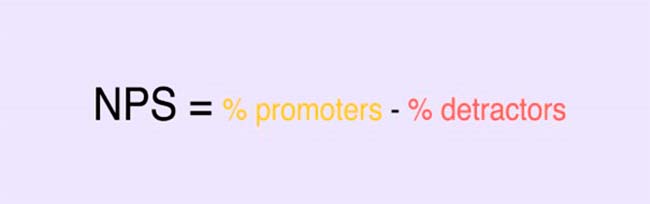
Everybody knows the Net Promoter Score, even if you’ve never heard of the term. The Net Promoter Score (or NPS) is a score calculated based on your customers’ answers to the following question: “How likely are you to recommend our product to others on a scale of 1 to 10?”.
The NPS score is a customer experience KPI. The higher it is, the more likely your customers are to recommend you, and the more satisfied they are. You can therefore conclude that you’ve delivered a quality experience.
The Net Promoter Score is also a tool that enables you to group your customers into three categories, called “promoters”, “passives” and “detractors” depending on their score. This segmentation helps to target your communications and personalise your relationship actions.
2 – Customer Effort Score (CES)
The Customer Effort Score is another key indicator for measuring customer experience. But whereas the NPS measures the likelihood of your customers to recommend you, the CES evaluates the level of effort exerted by a customer to achieve a specific action: an online purchase, signing up to a service online, making a claim, etc.
In other words, CES measures the seamlessness and simplicity of your customer journey. The less effort a customer has to exert to interact with a brand, the better their experience.
3 – Customer Satisfaction Score (CSAT)
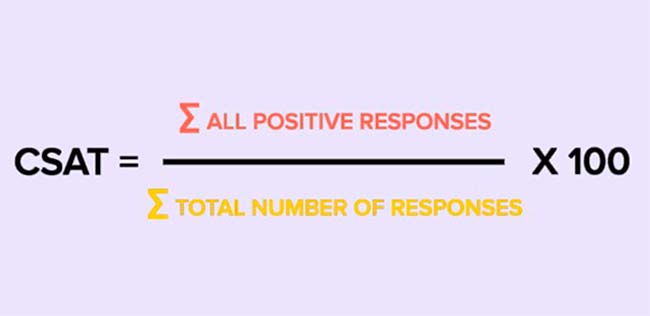
NPS enables you to measure the customer recommendation rate. CES, the seamlessness and simplicity of the customer journey. The next indicator is the most well-known and the most basic (which doesn’t make it any less useful!). It enables to directly measure customer satisfaction. It is, of course, the aptly named, Customer Satisfaction Score or CSAT.
CSAT can be used to:
- Assess overall customer satisfaction, with a generic question such as: “Overall, are you satisfied with the services provided by our brand?” or “How satisfied are you with our brand?”. This question can be asked at any stage of the customer journey (except right at the beginning when the customer hasn’t had time to form an opinion yet…).
- Assess a specific customer interaction. For example, you could send a survey after an online purchase asking your customers to rate their buying experience.
We’ve now taken a look at the 3 main indicators to measure customer satisfaction – indirectly with NPS and CES and directly with CSAT. After all, measuring customer experience means, first and foremost, measuring customer satisfaction. If your customers are satisfied, then they are happy with their experience with your brand. Customer satisfaction and customer experience are very closely linked.
4 – Customer Retention Rate for Customer Experience
The customer retention rate is a measure of your ability to retain customers. It is a good customer experience KPI. If you can retain your customers, then your experience is probably satisfactory.
Customer retention isn’t just about the quality of your products and services, or your prices. These days, the customer experience as a whole (before, during and after a purchase) creates an attachment (which is sometimes emotional) to your brand.
The retention rate is a KPI that doesn’t lie. Companies who offer the best customer experiences are also those with the best retention rates.
The retention rate is calculated over a given period. It can be obtained with the following formula:
[(total customers at end of period – new customers) / total customers at beginning of period] x 100.
E.g.: You have 1,000 customers at the beginning of the period. You have 1,150 at the end of the period. Over that period, you’ve registered 300 new customers. Which means that 150 customers have left. Indeed: 1000 + 300 – 150 = 1 150. So, by applying the mathematical formula above, your customer retention rate is: [(1150 – 300) / 1000 ] x 100 = 85%
5 – Churn Rate, a Mirror Indicator of the Customer Retention Rate
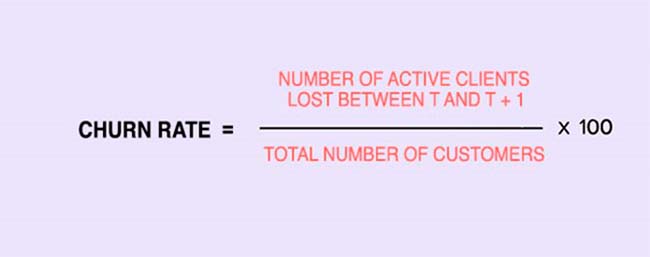
Churn refers to an erosion of your customer base. The churn rate measures the loss of customers over a given period. It is calculated by dividing the number of lost customers over that period, by the number of customers at the beginning of the period. The result is multiplied by 100 to obtain a percentage. Based on the previous example, the churn rate is: (150 / 1 000) x 100 = 15%.
You’ve probably already noticed: Retention rate + churn rate = 100%
Is your churn rate high? Your customer experience might not be living up to customer expectations.
Is your churn rate increasing? This most probably means that your customer experience is deteriorating.
Whatever your situation, it’s important to pay careful attention to your churn and retention rates.
Both the retention and churn rates allow to measure customer experience, but neither explain “why?”. If your churn rate is very high, then you know that you have a problem in terms of customer experience… but you don’t know where the problem stems from. Which is why you also need to use the satisfaction indicators listed above: NPS, CES and CSAT.
6 – Reactivity to Marketing Campaigns
The perceived quality of your customer experience also depends on the quality of the dialogue between you and your customers. This dialogue, more or less personalised and more or less automated and digitalised, takes place at all contact points. Particularly in your marketing communications. Customer marketing is one of the main customer dialogue levers, along with customer service.
Reactivity to marketing campaigns is calculated through different metrics, depending on the dialogue channel used. For emails, you’d look at the open rate, the click rate and… the reactivity rate. The reactivity rate is calculated by dividing the number of clickers by the number of openers. The result is then multiplied by 100 to give a percentage.
Reactivity is not a KPI, but a set of KPIs associated with a channel, which enable you to evaluate the effectiveness of your communications and solicitations. Of course, marketing campaigns don’t make up the entire customer experience, but we think it would be a mistake to not take this parameter into account, along with the management of marketing pressure, when steering your customer experience.
7 – Customer experience and Repeat Purchases
A key KPI for measuring customer experience is the number of repeat customer purchases. There are two reasons that a customer buys from you again:
- Your brand has a monopoly on the market.
- You offer an enjoyable and satisfactory customer experience.
So, unless you’re a monopoly, the percentage of customers who return to you each month (the reference period should be adapted to your products’ life cycle) is an important KPI to measure customer experience.
This brings our overview of customer experience KPIs to an end. When well-organised and well-deployed, these indicators can help you build an efficient customer experience management system. They are essential for monitoring the health of your business. So, what are you waiting for?