


Does your company provide B2B clients with digital services? Would you like to set up customer satisfaction dashboards? Then you’ve come to the right place. This article presents the basics and explains which main indicators to use to build an operational system. Choosing customer satisfaction indicators When building any kind of dashboard, there are two...

Does your company provide B2B clients with digital services? Would you like to set up customer satisfaction dashboards? Then you’ve come to the right place.
This article presents the basics and explains which main indicators to use to build an operational system.
Choosing customer satisfaction indicators
When building any kind of dashboard, there are two things to consider:
- What to include on your dashboards? What information would you like to display? This will vary depending on your objectives and dashboard use cases.
- How to design your dashboards? How do you want the information to be displayed?
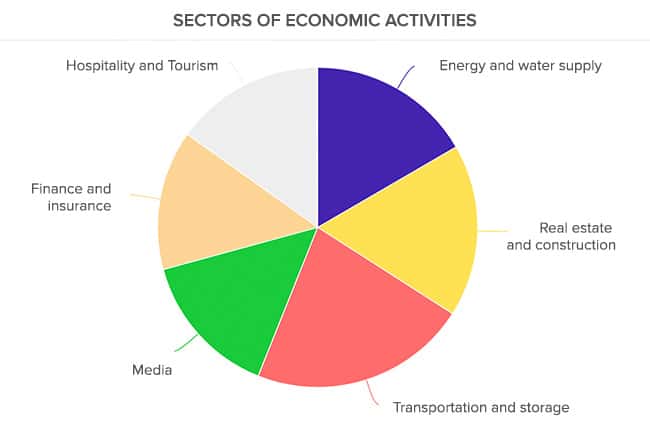
This article focuses on the first question, although both are linked. If you want to measure a breakdown (e.g. the breakdown of your B2B clients by industry sector), then you could use a pie chart. You will not, however, be able to represent this breakdown with a curve. The content of the information determines the way it is represented.
Three key customer satisfaction indicators: NPS, CSAT and CES
When building a customer satisfaction dashboard, you have to select one or more customer satisfaction “indicators”. Below are the three main ones:
- The Net Promoter Score (NPS), which measures the likelihood that your clients or users will recommend you to others. It is obtained by aggregating the answers to the following question: “On a scale of 0 to 10, how likely are you to recommend our [Company / Brand / Service / Product] to others?”
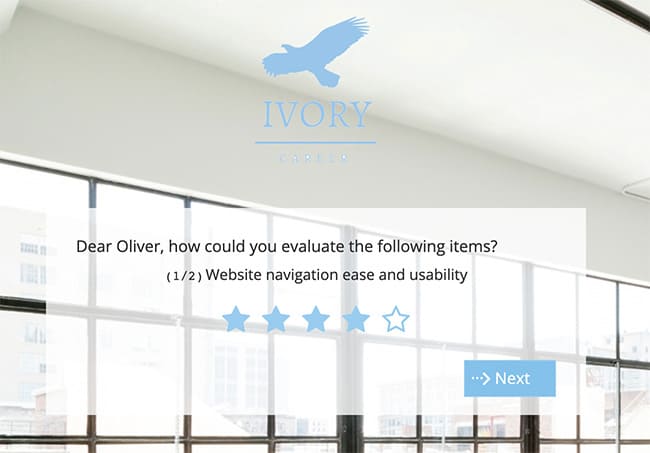
- The Customer Satisfaction Score (CSAT), which measures your clients’ satisfaction on a global level or in response to a specific client interaction, service etc. It is obtained by aggregating the answers to the following question: “Are you satisfied with X?”. The respondent can choose from 4 or 5 answers.
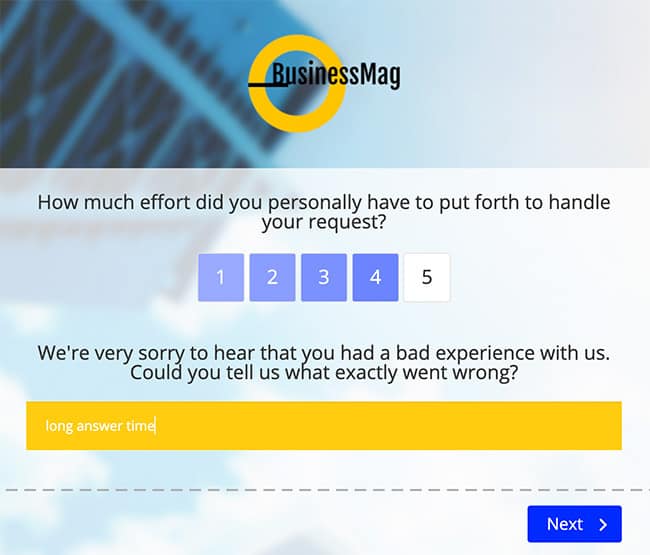
- The Customer Effort Score (CES), which measures the effort exerted by a client when using a service. It is obtained by asking your B2B clients the following question: “What level of effort did you have to exert to [Perform action X]?”
We have already written at length about these satisfaction indicators. To find out more about each one of them and how to use them, take a look at our blog. We particularly recommend reading this article!
Choosing satisfaction indicator analysis axes
You can choose to focus on one indicator: NPS, CSAT or CES. Or you may decide to use two, or even three. It is worth nothing though that CES has a special status. It is generally used as a complementary indicator alongside the NPS or CSAT, but rarely alone.
Once you have chosen your indicators, it is time to build the process that will allow you to collect answers from your clients: design a survey, deploy it to a targeted audience, collect the answers, synchronise the answers with your dashboards.
You then need to choose three analysis axes. Take the Net Promoter Score, for example. There are at least 3 potential analysis axes:
- Overall NPS score, which is expressed as a number between -100 and 100.
- Client breakdown by: Promoters / Passives / Detractors. This indicator allows to group clients into 3 categories. You can represent the data in the form of bars or a pie chart.
- Monitoring the monthly NPS evolution, represented in the form of a curve for example. Monitoring the evolution of your satisfaction indicators over time is essential.
If you choose this indicator, we recommend incorporating these three axes into your dashboards. But it is also interesting to measure customer satisfaction at every step of the customer journey, with every service, product, etc. We will come back to this in a moment, but first let’s take a look at one last way to measure your overall customer satisfaction.
Measuring your clients’ perception of your strengths and weaknesses
Strengths generate satisfaction. Weaknesses generate client dissatisfaction and frustration. It therefore makes perfect sense to measure your perceived strengths and weaknesses on a customer satisfaction dashboard.
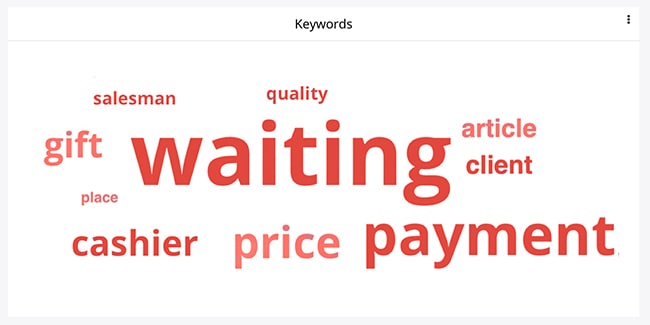
We strongly recommend asking your B2B clients what, in their opinion, your company’s strengths and weaknesses are, via a survey. Ask: “In your opinion, what are our main strengths?”. You can also ask the question indirectly, for example: “In your opinion, what do we do better than our direct competitors?”. And, of course, don’t forget to ask your B2B clients about your weaknesses:
- Your strengths, as seen by your clients, are areas you should capitalise on. These are things to highlight in your value proposition and sales pitch.
- Your weaknesses enable you to identify areas for improvement, whether in your company, services, or products. These should be part of your continuous improvement strategy.
Measuring customer satisfaction with your customer journey, services, and offers
Let’s come back to our earlier topic. NPS or CSAT scores should not only be measured at a global level. You should also measure client satisfaction with your customer journeys, services, and offers.
Measuring satisfaction at every step of the customer journey
The quality of your customer journey has an impact on client acquisition and retention. Client journeys directly impact customer experience.
Let’s take the sales phase, for example. The sales stages at the beginning of the customer journey have a major impact on your commercial performance as a service provider, i.e. your ability to turn leads into clients. Why not ask your leads about their satisfaction at this stage?
You could, for example, send your leads a satisfaction survey during the conversion phase, including a CSAT question: “Are you satisfied with our sales team?”. You could go even further and enrich your survey by asking your leads about the quality of the documentation they received, your sales representatives’ availability, understanding of their needs, etc.
At the other end of the customer journey, you may find it interesting to ask your clients about their satisfaction with Customer Success. Customer Success Management significantly impacts customer retention. What do your B2B clients think of the support provided by their account manager?
Once again, don’t hesitate to use these surveys to ask your clients about your strengths and weaknesses. E.g.: “What do you appreciate the most about our Customer Success?”, “How do you think we could improve the support provided by our sales representatives?”, etc.
Measuring satisfaction with your services
Customer experience is the sum of all your clients’ experiences at the different touchpoints of your customer journey, and also in their use of your products and services. You can offer a flawless customer service, but if your products and services do not satisfy your clients, they will eventually leave.
You should therefore measure your clients’ satisfaction with the services and products provided by your B2B company. Once again, the easiest way to do so is to send surveys to the companies using your services. If you offer several services, products, software, or modules, then ask your clients for feedback about each one. Ask which ones they appreciate most, which ones add the most value, and which ones bring the most satisfaction. Then, incorporate the satisfaction data you collect into your dashboards.
You can use NPS, CSAT and CES indicators for this. You can also use the strengths and weaknesses axe again. The aim: to ensure that your clients are satisfied with your services and products, and that the latter are meeting their needs and expectations.
One last tip: feel free to ask questions about specific aspects of your services or products. For example, if you are a SaaS solution developer, ask your clients about the interface, different features, etc.
Measuring satisfaction with your offers
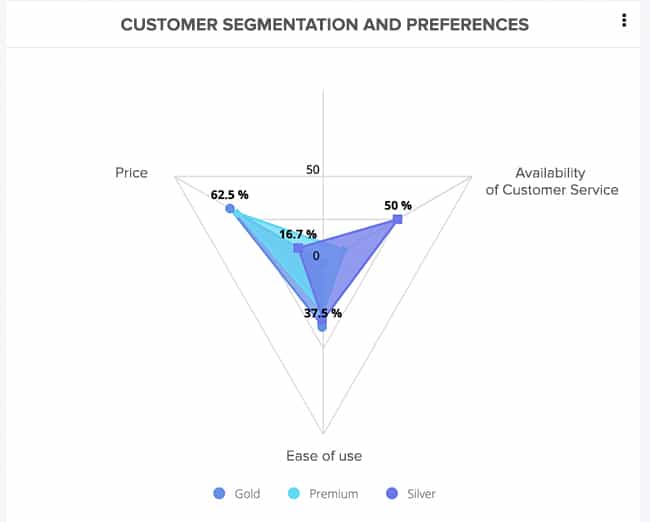
For a digital services company, designing offers and choosing a pricing model can be complex. Single pricing, custom pricing, bundled pricing, pay-per-use pricing, staggered pricing…? The choice of pricing model is a defining element for companies – particularly in the SaaS software world.
Pricing models can be adjusted and continually improved. So, why not ask your B2B clients what they think about your pricing and offers? Reach out to your clients to optimise your offers and ensure that they match your target clientele’s expectations.
Two bonus ideas to enrich your customer satisfaction dashboards
You can produce complete, accurate, and informative customer satisfaction dashboards using all the information listed above. You could also enrich them with additional information. We have two suggestions for this.
Add a Customer Knowledge layer to your dashboards
You are a service provider. You have clients. These clients are companies. But who are these companies? Do you know your clients? You want to measure your clients’ satisfaction – it therefore makes sense to include some information about them onto your dashboards, to get to know them better.
We suggest including information about your clients based on firmographic criteria: size of company (small, medium, large company…), industry sector, number of employees, turnover, number of employees using your services within the company…
Identify your acquisition channels
Where do your B2B clients come from? How did they find out about you? These are important questions. The answers are even more so; they will help you improve your acquisition strategy and optimise the allocation of your marketing efforts.
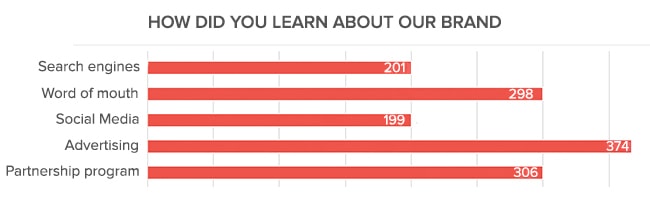
If you organise time-consuming and costly events, but only a handful of your clients discovered you in this way, is it worth continuing to invest so much in this acquisition lever? Similarly, if you invest 2 000 euros a month in Google Ad campaigns, but none of your clients discovered you by clicking on a Google Ad, then this acquisition channel may not be well suited (or your advertising campaigns are not well designed, which is another possibility!).
On the flip side, if most of your clients discovered you through your website, then it is in your interest to focus your efforts on this channel. Etc. Etc.
It is important to have a clear understanding of your sources, levers, and acquisition channels. Ask your clients about them and include their answers in your dashboards.
Conclusion
This article is now drawing to an end. We hope that it has answered at least some of your questions. We have provided you with some general guidelines, but of course each company has its own objectives, specificities, and organisation, from which to build operational dashboards – the purpose of dashboards being to facilitate the transformation of information into action.
You will need to use surveys to collect data to feed into your customer satisfaction dashboards. If you don’t have any tools yet to build and deploy surveys, then please note that CX Management offers a complete customer knowledge solution. Get in touch with our teams to find out more.
<!–[if lte IE 8]><![endif]–> hbspt.cta.load(20304540, ’50ae5644-02d5-4330-9b0d-0e79812f8ce1′, {“useNewLoader”:”true”,”region”:”na1″});