


In Retail, as in any other industry, process improvements require continuous performance management. You can only improve what you can measure.
The main thing to consider when building a management dashboard is which performance indicators to include.
If you are in Retail and wondering which indicators you should include in your management dashboard, then this article is for you. We will not discuss (or only briefly) the basic indicators that everybody knows, such as the average basket, turnover, etc.
Instead we will focus on the indicators that we feel are essential, but that are not always presented as such.
Indicators for measuring customer satisfaction
Let us begin with the indicators for measuring customer satisfaction. If you read this blog regularly then you know how important they are. The key to all customer retention strategies is customer satisfaction. If you wish to increase customer loyalty, your primary goal should be to satisfy them. You can improve customer satisfaction by measuring it with indicators.
The three main indicators are the Net Promoter Score (NPS), the Customer Satisfaction Score (CSAT) and the Customer Effort Score (CES).
To find out more about these key satisfaction indicators, please read our article Customer Satisfaction: Do you know the 4 key measures?.
You can use one or more of these indicators. Combining two indicators provides you with more information, but it also increases KPI maintenance costs. If you are on a tight budget, we recommend initially focusing on one indicator.
Below are the main lines of analysis for satisfaction indicators, using the NPS as an example (the same applies to the CSAT or CES).
Overall Net Promoter Score
The Net Promoter Score allows you to group your customers into 3 categories: Promoters, Neutrals and Detractors. The NPS Score is calculated by subtracting the percentage of detractors from the percentage of promoters. For example: 50% promoters – 8% detractors => NPS = 42. In your dashboard, we recommend adding the percentage of promoters, neutrals and detractors alongside the NPS score itself.
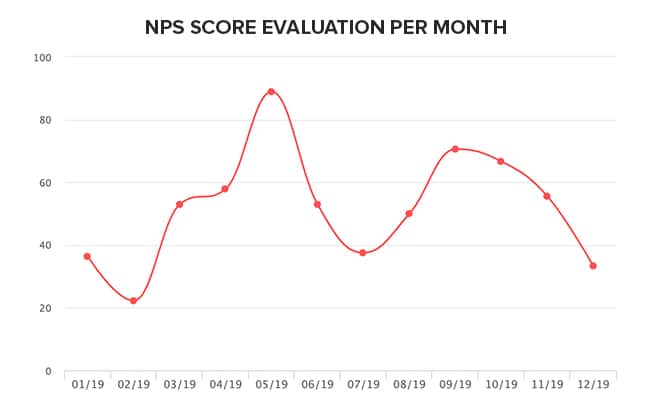
NPS evolution (monthly)
You can measure the evolution of your NPS score each month, by representing it in the form of a curve. We highly recommend this. Do not just take a snapshot of a given moment. You need an overall view over time to identify the downwards and upwards trends.
NPS by product range
You can evaluate your customers’ likelihood to recommend your business to family and friends through the NPS. You can calculate your company’s NPS by asking the following question:
“On a scale of 0 to 10, how likely are you to recommend our company to friends, family and colleagues?”
You can also calculate an NPS:
- By brand if you are a multi-brand business.
- By product range or category.
- By product or service.
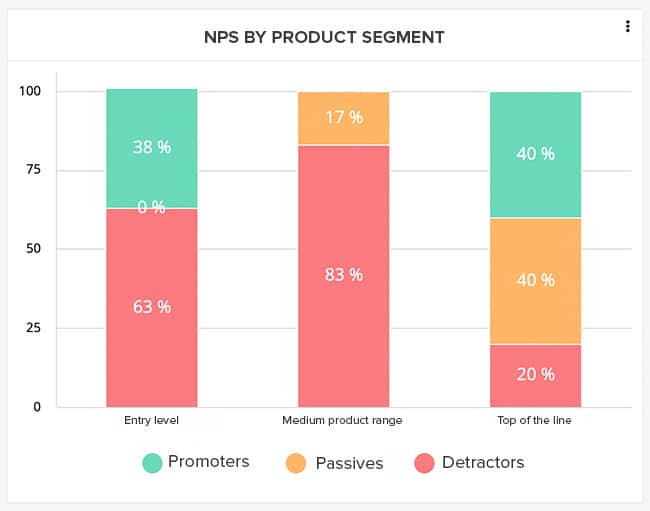
You can thus carry out a more granular analysis of customer satisfaction.
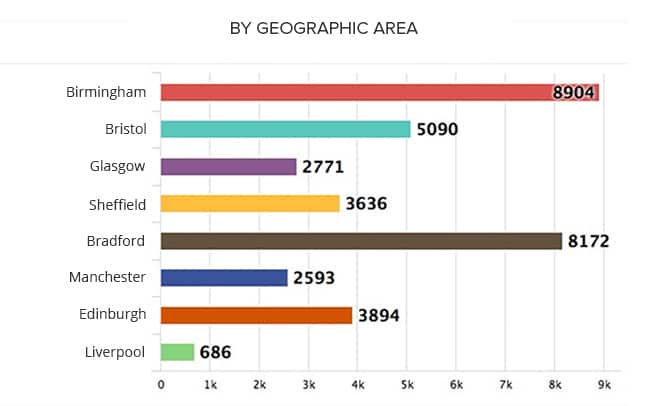
One last thing before moving on to the second family of indicators – if you operate in different regions / geographical areas, you should consider creating a dashboard per territory + a “National” one, combining all the dashboards’ data. To find out more, please read our article (last section): “Retail: Create your ideal customer satisfaction barometer”.
Customer knowledge indicators
Let us now take a look at a series of indicators focusing on Customer Knowledge to enrich your Retail management dashboard.
Acquisition channels
Where did your customers come from? How did they hear about you? The answers to such questions will help you improve your customer acquisition strategy and optimise the allocation of your marketing resources. Why invest half of your marketing budget in AdWords campaigns if only 1 in 100 new customers come from this source of acquisition? The analysis of acquisition sources is often highly instructive (and sometimes disappointing).
Ask your customers how they heard about you: the internet, social media, word of mouth / recommendation, marketing / advertising campaign, came across a shop by chance, etc. This information can be obtained through customer surveys.
Your customer profiles
Who are your customers? You can also include data about your customers’ socio-demographic profiles in your management dashboard:
- Breakdown by age or age group.
- Breakdown by gender.
- Breakdown by geographical area (for the National dashboard).
The role of the internet in the buying journey (website, click & collect)
Are you customers digital? How do they use the internet? How does the internet contribute to your in-store traffic/activity?
For most Retailers, the internet has become a key lever for growing business. To measure the role the internet plays, we recommend monitoring these two key indicators:
- Revenue generated by Click & Collect. Assuming of course that you provide this service.
- Proportion of physical customers who visited the website before going to the shop to make a purchase (for information about products, to browse the catalogue, special offers, etc.). You can collect this data by sending a satisfaction survey to customers after an in-store purchase.
Your company’s strengths… according to your customers
What do your customers consider to be your strengths? What do they like about you? Why are they loyal to your brand? Is it because of:
- The quality of your in-store welcome?
- Your in-store customer experience?
- Your products’ value for money?
- The quality of your products?
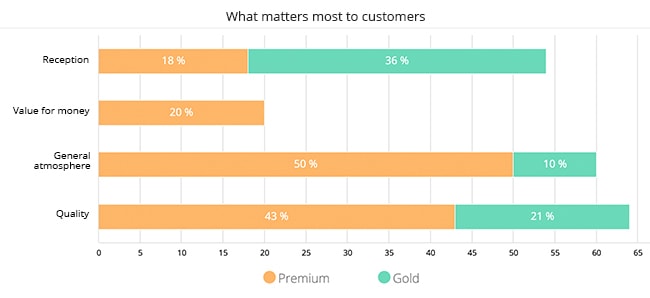
Knowledge of the above will help you identify your strengths and areas for improvement.
Indicators for measuring your marketing efforts
Have you deployed marketing efforts to acquire and retain new customers? Have these efforts paid off? It is essential to measure the performance of your marketing efforts. The indicators you choose to include are of course dependent on your marketing channels, the nature of your marketing operations, etc. Nevertheless, the ones below should not be missed:
Number of marketing campaigns per period
This indicator measures the efforts you have invested in marketing over a certain period (month, quarter, semester, or year). You can create one indicator per channel: email, SMS, AdWords, displays, etc. You can also calculate the total amount spent on your campaigns.
But these indicators only make sense if you consider them in relation to the results of your efforts. Which leads us to the next management indicator:
Revenue generated by your marketing campaigns per period
You can calculate the revenue generated by your marketing campaigns. If you use emails for marketing purposes, for example, then you can measure the number of purchases made after an email click. Make sure to use the same reference period for this calculation.
Here are a few more examples of useful indicators for performance marketing management:
- The number of new customers acquired through marketing campaigns.
- The growth of your customer base. For example: an increase in the number of subscribers to your newsletter.
- Indicators relating to your website performance (some only apply if your business is an ecommerce site):
- Number of page views / unique visitors / sessions on your website.
- Google Analytics goal conversion rate. In e-commerce, it is worth calculating the percentage of visitors having added a product to their basket, or the percentage of visitors having created an account.
- Basket abandonment rate.
- Number of items per basket.
- Average basket.
Note: Unlike the indicators discussed earlier, the data required to build these indicators cannot be obtained via customer surveys or polls. This data comes from your marketing tools: email software, marketing automation software, Google Ads, Google Analytics, etc.
Beyond quantitative indicators – verbatims
The above indicators are all quantitative. They are presented in the form of numbers, percentages, etc. They are all essential for business Retail management, but we would also like to draw your attention to customer verbatims.
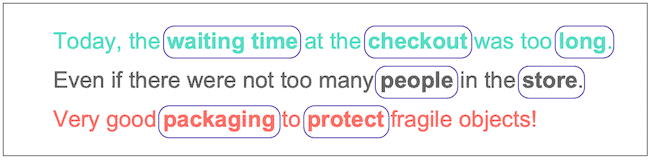
Verbatims are a valuable source of information for understanding your customers, their aspirations, expectations, satisfaction, and potential disappointment. This can take on the form of reviews published on your website, comments in survey free-text fields, answers to open-ended questions, or customer interviews.
Discover how to Turn customer comments into management indicators with verbatim analysis. This article discusses several methods to analyse verbatims in a semi-automated manner.
Discover several ways to incorporate verbatims into your management dashboard.
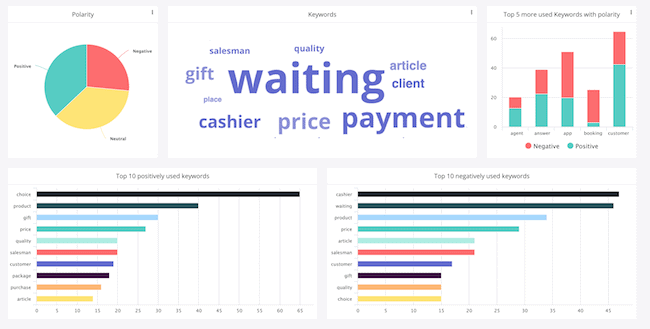
Breakdown of positive / negative comments
You can begin by organising comments into two categories: positive and negative. You can identify the polarity (negative/positive) through semantic analysis. At Feedback Management, we offer a tool that automatically detects if a verbatim is negative or positive, based on the choice of words.
This indicator perfectly complements the satisfaction indicators discussed at the beginning of the article.
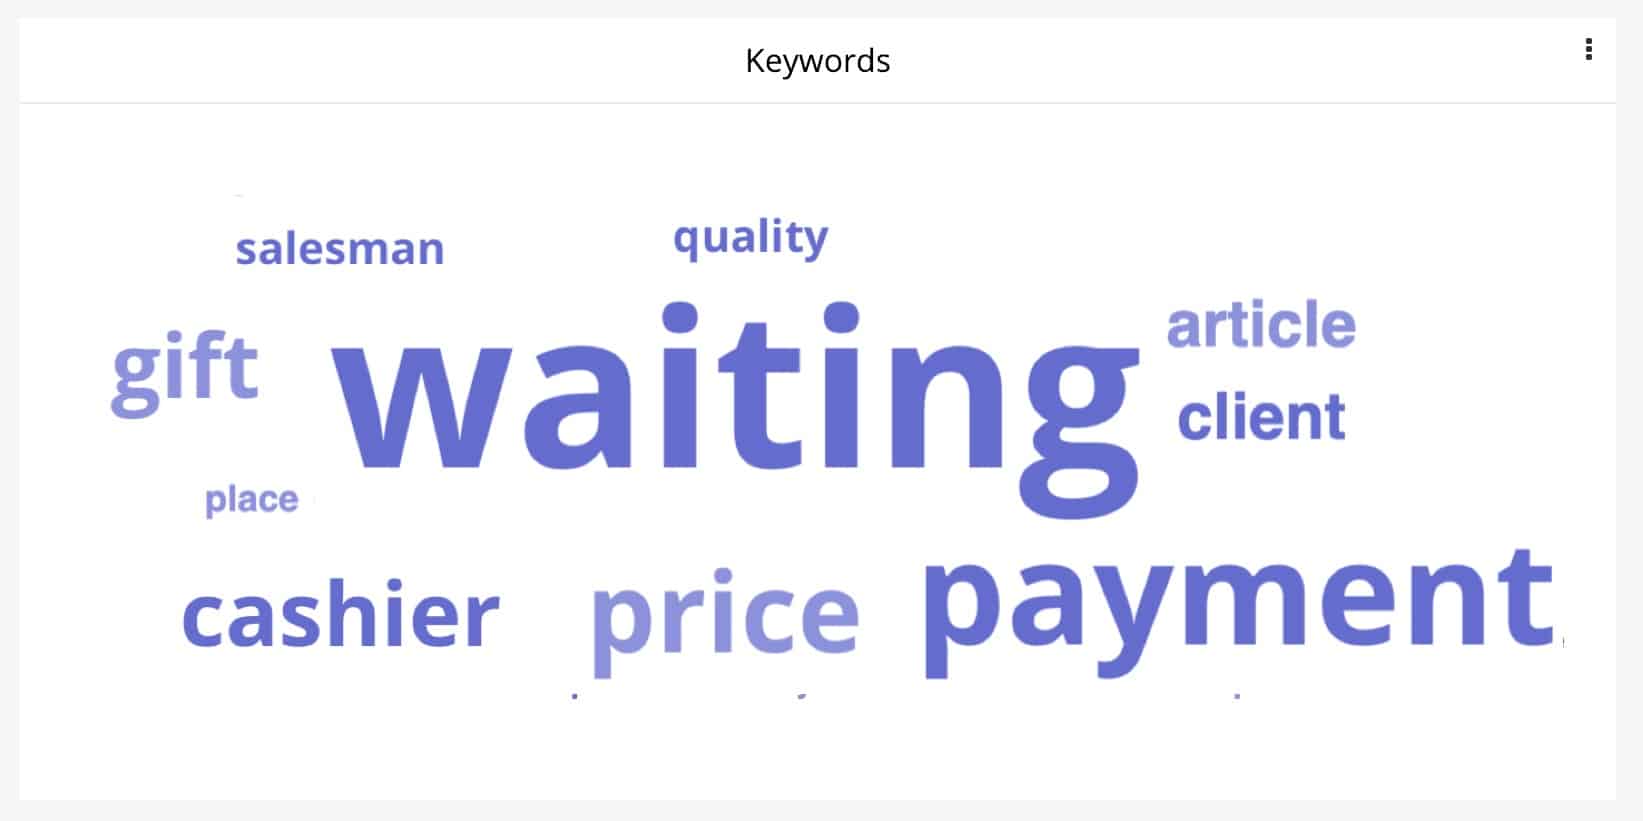
Most common customer words
You can identify which words are the most used by your customers by analysing their occurrence in the verbatims.
The results of this analysis can be presented in the form of a keyword cloud and/or in the form of an ascending list of the most frequent words.
It is also possible to identify the most common words used by satisfied and dissatisfied customers. Simply simultaneously collect (through one survey for example), verbatims and satisfaction scores.
This article is now drawing to an end. There are lots more Retail management indicators than those discussed above, but we hope to have given you a few ideas about how to create or enrich your dashboard. The quality of your dashboard will of course depend on the quality, quantity, and relevance of the underlying data. How do you collect data to build these indicators? For most of the indicators explored in this article, the answer lies in two words: customer surveys.
<!–[if lte IE 8]><![endif]–> hbspt.cta.load(20304540, ‘381919ff-e7c9-4fd1-aff8-9ed948a2e4e6’, {“useNewLoader”:”true”,”region”:”na1″});